
This evening I spent a number of hours playing around with Google Labs Ngram Viewer, a fantastic tool that graphs word frequencies found in the huge collection of scanned books amassed by Google Books. It is as easy as choosing some keywords, selecting a language collection, choosing a timeframe and hitting return on your computer keyboard. In a flash the viewer graphs the frequency that the words occur in Google Books over time. Choosing multiple words separated by commas adds data lines to the graph, which the viewer renders in different colors.
I began choosing English words, before I realized that Google Books has a collection of Chinese books. To get an idea what it could do, I typed in one of the most popular Chinese words of the 20th century–“revolution” (革命). A moment later a nicely formatted graph popped up showing a growing frequency of the word’s appearance in Google’s collection. The graph illustrates how “revolution” increased appearance until the late 1960’s followed by a decline–a frequency that seems to accurately reflect historical reality. (The fact that it looks like a volcano adds a certian poetic effect!)

Captivated, I began to enter other words from recent Chinese revolutionary history–assuming they would provide dramatic slopes both up and down. I tired some of the Cultural Revolution mainstays: “paper tiger” (纸老虎, in blue), and “running dog” (走狗, in red) for one graph, and then “serve the people” (为人民服务) for another, and “comrade” (同志) for a third:
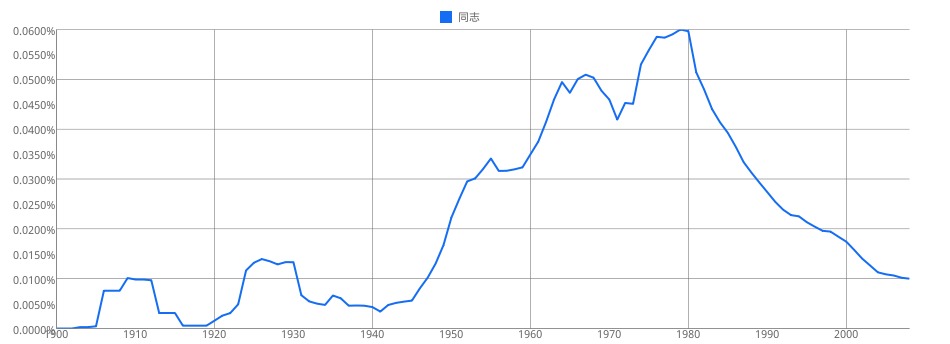


Predictably, the frequencies of usage of these words peaked during the Cultural Revolution period and then declined. Even the rising and falling fortunes of the workers (工人, blue), peasants (农民, red), soldiers (军人, green) and intellectuals (知识分子, yellow) were nicely displayed:

Mapping Historical Trends?
After passing these initial runs, I thought I’d create some graphs that used multiple terms to see if I could generate a graph that would comment more directly on historical trends. I started with a basic search for the names of Chinese leaders. As might be expected, Mao Zedong (毛泽东) offers a giant blue line peaking around 1968, followed by the smaller lines of Deng Xiaoping (邓小平, red), Jiang Zemin (江泽民, green) and Hu Jintao (胡锦涛, yellow).:

What I find most fascinating about the graph of the leaders, however, is the second rise in the frequency of references to Mao Zedong that corresponds precisely with the Mao Craze of the early 1990’s. In fact the graph suggests that the frequency of appearances of Mao the second time around is persistently larger than the current leaders at the time.
What about some other keyword searches that might yield information about trends? I tried:
“struggle” (blue) and “construction” (red)
“feudal” (blue) and “modern” (red)
“workers (blue) and “reform” (red)
“Cultural Revolution” (blue) and “Four Modernizations (red)”
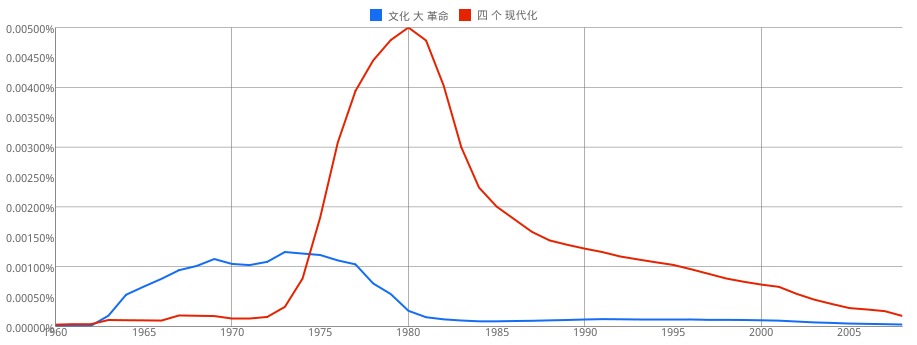


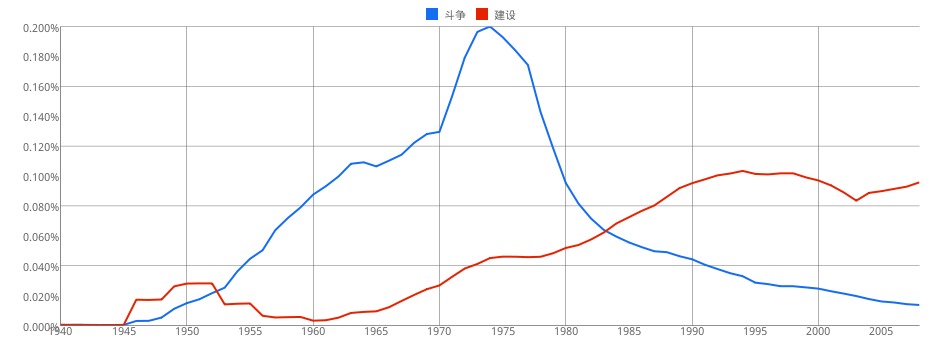
Again, as might be expected, the frequencies of these words decline and rise at times reflecting historical changes. What I find interesting, however, is that the frequencies of these word usages cross in the 1980’s–providing an interesting image of the linguistic transformation that accompanies the social transformation of everyday life during that period. The Nviewer offers a way to locate an exact moment in history where one concept becomes ascendant over another.
Moving to three or four terms, I chose keywords that might map more sophisticated relationships. Aware of the decline of the status of workers in the reform period, for example, and the concomitant rise of the problem of population, I tried “workers” (blue), “population” (red) and “reform” (green):

As with earlier searches, the lines all converge in the early 1980’s. As “workers” lose status references decline–while at the same time preoccupation with population rises. Of course, I am not suggesting that there is necessarily a direct relationship between these particular terms. The graphs the tool creates, however, do show interesting relationships that could be used for siting research questions.
The Socialist Period—-when the party more overtly managed the press and publication industry–there was a much narrower field of terms in the published record. In this sense, it is an easy target for this kind of word frequency search. I noticed that for many terms the high frequency trails off in the late 1990’s. Perhaps the effects of consumer market economy on the publishing industry have “diluted” the central government’s dominance over public discourse affecting the frequency with which certain words might appear? This, of course, would be an interesting project to pursue.
Mapping Social Trends?
I was, however, curious if I could create maps that indicated the move away from the socialist period towards the market economy. Could the Ngram viewer map words, for example, dealing with consumption that would illustrate the increases observed after 1979? I tried some hot commodities from the early reform period–refrigerator (red), bicycle (blue), and washing machine (green). Just as a control I added cellphone (yellow) which, as expected, yielded no references. The results illustrate an interesting progression of desire that moves from bicycle to refrigerator to washing machine as indicated by the slowly sloping lines:

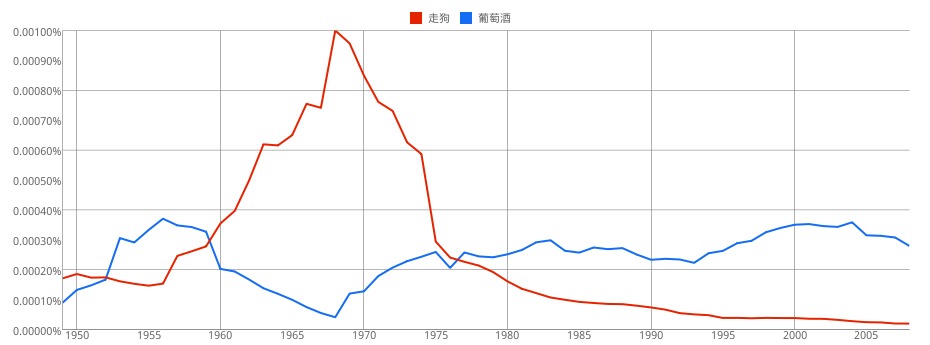
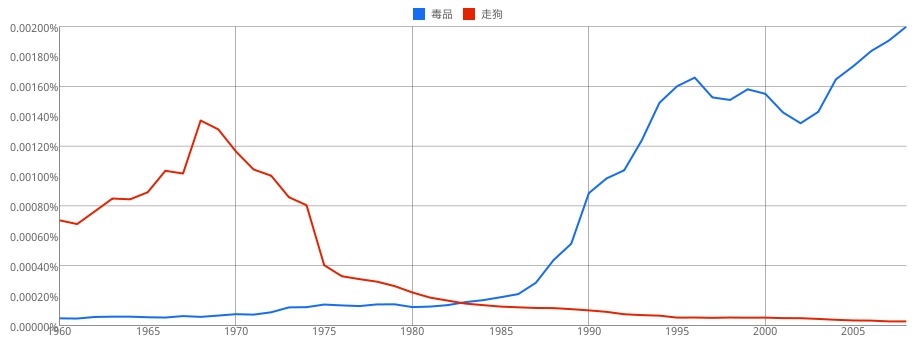
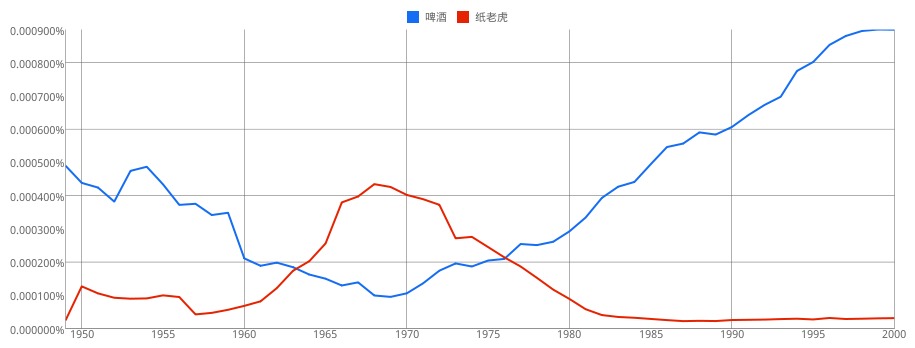
The displacing of “revolution” by “consumption” can be visualized by mapping the revolutionary terms of the Cultural Revolution to some of the commodities of the reform era. This yielded some interesting (if predictable) relationships. The revolutionary terms are, of course, in red:
“red flag” (red) and “computer” (blue)
“running dog” (red) and “drugs” (blue)
“paper tiger” (red) and “beer” (blue)
“running dog (red) and “wine” (blue)

Finally, I mapped some of the words which correspond to social concepts that have been examined by anthropologists who work in China. I started with the concepts of “quality” (素质, red) and “civilization” (文明, blue) two terms which have played an important part in the new class formations of the reform period. The graph that the Nviewer produced showed two dramatically sloping lines right where they should be–in the mid-1980s!

Moving to some of the terms that were central to my dissertation work on social memory and nostalgia for the Cultural Revolution in the late 1990s, I tried “nostalgia” (怀旧) and got a line with a predictable increase.

That the line peaked most dramatically right at the time that I noted it during my fieldwork, at least anecdotally supports some of the observations of my fieldwork. My project dealt primarily with former “educated youth” (知青, blue) many of whom had been “laid off” (下岗, red). So I thought I’d try these two terms–which yielded a peak in the mid-1970s for the educated youth and another in the late 1990s when being laid off was at its peak.

Of course, everyone in the late 1990’s complained how much things had changed–that there was more corruption (腐败, red) and less of the community ethos of the past–expressed by slogans such as “serving the people” (为人民服务, red)–a discussion reflected on the following graph:

At the end of a few hours of playing around with the Ngram viewer, I was astonished by the power of the search engine to quickly map word frequencies, and by the way that it was very easy to quickly create graphs that reflected historical and social trends in China.
The viewer has just been released and is currently being discussed in articles like this one in Scientific American, that describe it as a quantitative tool to examine trends. Of course, its power depends much on the books in Google’s collection–of which I have not yet been able to take much of a close look. Also, there is the question, particularly in China of the relationship between a words frequency of appearance and the control of printed public discourse–say during the Cultural Revolution, for example.
I must say, however, that the Ngram viewer is an interesting tool for visualizing social and historical trends. It might be very useful for locating moments in the archive, for example where closer historical research might be done. In the case of China, for example, my brief few hours with it illustrated for me the dramatic changes that occurred in China in the 1980’s.
